

Article by Elizabeth Dabney
In the July/August 2019 issue of Net Assets, my colleague Mary Kay Markunas pondered the impact of the Tax Cuts and Jobs Act — passed in December 2017 — on annual giving to independent schools. Like many others, she feared the law would have a chilling effect on charitable contributions and subsequently annual giving.
Annual Giving
Data from Business Intelligence for Independent Schools (BIIS) FY19 is in, and while it does not currently show cause for alarm, this indicator bears watching in the coming years. The data provided by participating schools showed that:
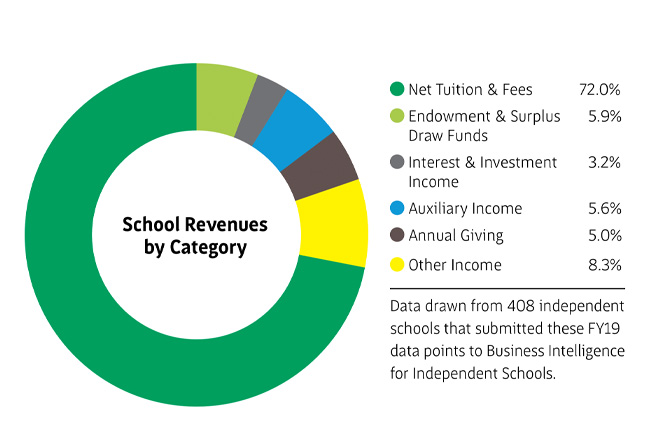
- Annual giving continued to be a small part of school revenue. In FY19, annual giving was 5% of revenue, similar to FY18. This is a smaller proportion of revenue as compared to net tuition and fees (72%), endowment and surplus draw funds (5.9%), and auxiliary income (5.6%). However, in the BIIS data set alone, more than 150 schools expected more than 5% of their revenue to come from annual giving.
- Annual giving has not been growing steadily. Annual giving per student decreased 1.2% (from a median of $1,245 to $1,230) from FY17 to FY18, and then rebounded 1.7% to a median of $1,251 in FY19.
- New England and the East fared well despite regional fluctuations. From FY17 to FY19, most regions saw that median annual giving per student followed the national pattern of dipping and then rising. However, independent schools in New England and the East (New York and New Jersey) saw an increase from FY17 to FY18 and again from FY18 to FY19.
- Annual giving at schools with boarding outpaced annual giving at other types of independent schools. In FY19, schools with boarding brought in more than double the annual giving dollars per student than day schools ($3,156 and $1,364, respectively).
But this is only part of the story. Many independent schools look to annual giving to fill the ever-growing gap between the net tuition and fees collected and the total costs of running schools. NBOA’s newest research report, “Financial State of the Industry: BIIS 5-Year Trend Report 2015-2019,” found that over five years, the average gap between total operating expenses per student and net tuition and fees per student increased $609 among the schools in this study. Average annual giving per student among these schools increased $8. While annual giving did not take a big hit under the new tax law, schools might not want to rely on annual giving to fill the gap. To read more about the financial health of independent schools, visit nboa.org/FSI.
While annual giving did not take a big hit under the new tax law, schools might not want to rely on annual giving to fill the gap.
Endowments
Another research effort, the Commonfund Study of Independent Schools, reflected on the effects of the tax law on gifts to endowment. The report questioned whether declining gifts to endowment from FY17 to FY19 indicates a worrisome trend or a return to normal after a strong giving year in FY16. To learn more about independent school endowments, visit go.nboa.org/CommonfundStudy.
How do these national trends compare to the trend in annual giving at your school? If your school participated in BIIS, you can find out by logging in and reviewing your NBOA Financial Dashboard. Annual giving per student is a key indicator, and you can compare your annual giving trends to peer schools. Given the current uncertain environment our schools find themselves in, along with the challenged economy, it will be even more important to understand your school's annual giving and endowment patterns and adjust expectations for the coming fiscal year.
