

Article by Mary Kay Markunas
This past spring, NBOA staff presented at several conferences, from Maryland to Hawaii. The travel gave us the opportunity to examine data from BIIS (Business Intelligence for Independent Schools) by region, a first since launching the new data collection platform. It appears the Western region of the U.S. had a better year than the rest of the country. This correlates with anecdotal information shared with NBOA staff — that demographics in the West have been favorable the past several years.

BIIS will reopen between August 19 and October 11 so that more schools can enter their data and take advantage of reporting tools. Visit biis.nboa.org for updates, tools and new data analysis.
In fact, net tuition revenue, expendable financial resources and total net assets increased in most schools in the West from fiscal 2017 to fiscal 18. Fewer schools in the Mid-Atlantic and Texas/Colorado* showed increases in the same areas than both the national average and counterparts in the Midwest and West. In all four regions, median increases in total unrestricted revenues were greater than the median increases in operating expenses, which indicates that schools are successfully controlling spending.
The tax code changes passed in late 2017 — which make it more difficult for people to reach the threshold required to qualify for a charitable write-off — did not seem to affect annual giving by the end of fiscal 18. Increased annual giving at most schools may account for the overall increase in unrestricted revenues, despite fewer schools showing increased net tuition revenue. Now that most donors have filed their tax returns, however, I expect the real impact of the loss of the charitable deduction will appear in fiscal 19 results. I can only hope I am wrong.
Here are the regional results:
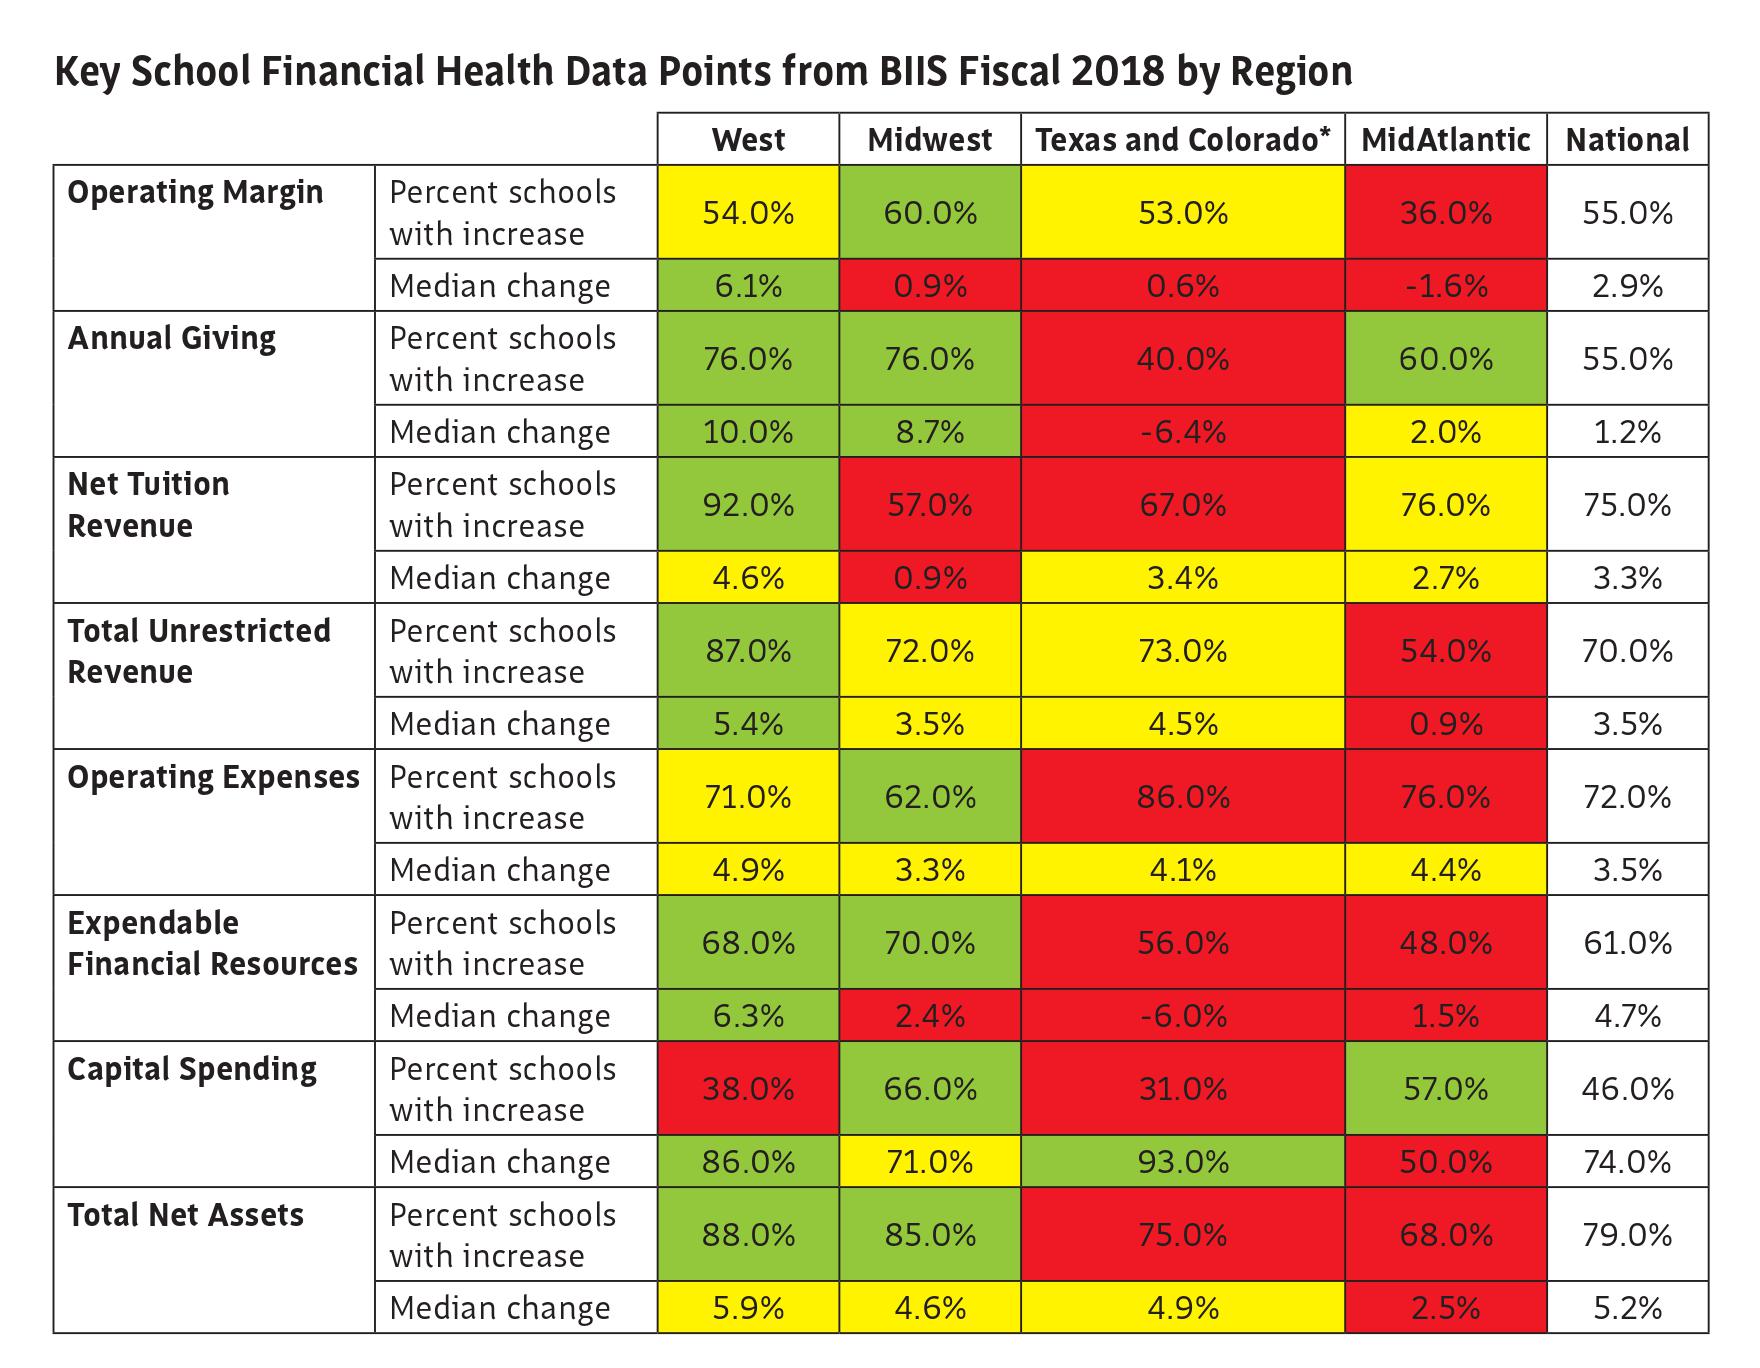
Green
Percent schools with increase: >3% national average
Median change: >1.5% national average
Yellow
Percent schools with increase: within 3% national average
Median change: within 1.5% national average
Red
Percent schools with increase: <3% national average
Median change: <1.5% national average
*Texas and Colorado data were collated for the Independent Schools Association of the Southwest at its request but do not correspond with a U.S. region in the BIIS platform.
Mary Kay Markunas is NBOA’s director, research and member resources.
Download a PDF of this article.
