Article by Genevieve Madigan
Is your school reinvesting in your facilities more than they’re depreciating? Your capital spending ratio can reveal whether you’re spending enough now — or potentially on the hook for a much bigger bill later. This number is also a simple way to give your trustees a de facto referendum on how well they’re tending to what is likely the school’s largest asset, if not also its most visible differentiator in a competitive market.
At a minimum, we recommend a capital spending ratio of at least 100 percent, which would reflect base-level facilities maintenance.
To calculate your school’s capital spending ratio for any given year, divide total capital expenditures by depreciation (capital expenditures are found on your statement of cash flows). Capital expenditures include all funds invested in buildings and equipment that are critical to business operations, from replacing the boiler or restoring the sidewalks to constructing a new performing arts center or STEM building. At a minimum, we recommend a capital spending ratio of at least 100 percent, which would reflect base-level facilities maintenance. A ratio above 100 percent means you are actively improving the condition of your facilities. Anything lower suggests that their condition is diminishing, your deferred maintenance bill is climbing and your ability to deliver program and support enrollment may be weakened.
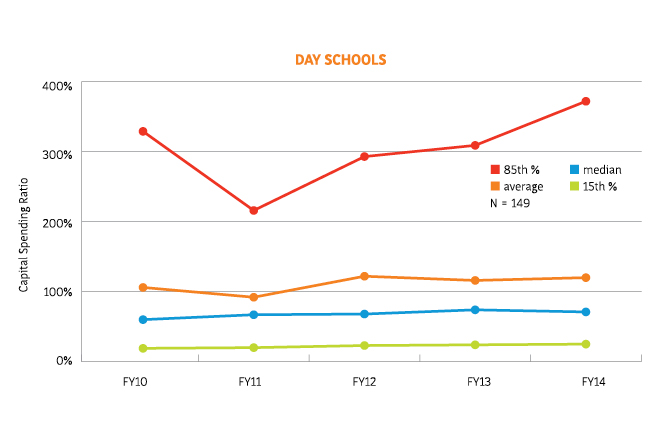
Capital spending ratios are among dozens of data points tracked in NBOA’s 2009–2014 Financial Position Survey Five-Year Trend Report. In that time span, the average capital spending ratio for day schools (based on a control group of 149 schools) averaged well over 100 percent most years, reaching a post-recession high of 120 percent in 2014. The median, however, was a more concerning 71 percent in 2014. Ratios at the outer edges reveal wide variances, from lows in the mid-20s to highs of over 300 percent among schools that are spending heavily to attract future generations of students.
The report also tracks capital spending ratios at schools with boarding programs (defined as having more than 25 boarders). These ratios are higher than at day schools (2014 average of 162 percent, 2014 median of 138 percent), but that likely reflects dorms and other facilities that demand greater investments.
NBOA is now collecting data on capital spending ratios and much more for the subsequent two years after 2014. Schools may participate in the current Financial Position Survey until April 12, 2017.
Genevieve Madigan is NBOA’s vice president of professional development and research.
Download a PDF of the article.


