

|
Article by James Palmieri
This fall, NBOA began demonstrating the power and potential of its signature data-collection platform, Business Intelligence for Independent Schools (BIIS), through new data benchmarking, trend analysis, tools and reports available in the platform. One new foundational tool, The NBOA Financial Dashboard for Independent Schools, is now available to schools that participated in BIIS. Users can download a school-specific financial dashboard pre-loaded with 12 key financial indicators designed to improve internal communication and measure operational performance.
In The NBOA Financial Dashboard for Independent Schools, the following 12 high-level data points serve as key financial indicators to help schools ask the necessary questions for managing the fiscal health and long-term sustainability of their institutions:
|
Income Statement Data Points |
Balance Sheet Data Points |
|
|
|
|
|
|
|
|
|
|
|
|
Here’s a closer look at how schools can use their school-specific dashboard to track one common industry benchmark: staff productivity.
Operating Expenses
Staff productivity is essential to the traditional independent school business model. Personnel appropriately represent the lion’s share of expenditures, and growth in academic and non-academic staff are key drivers of budget and tuition increases. The stacked bar chart for one indicator, operating expenses, includes a year-over-year summary and comparison of primary expenses at an example school.
A school’s annual budget should be the financial translation of its mission and strategic vision. It should clearly support the school’s program and intended outcomes as well as manage the school’s cash flow to ensure smooth operations throughout the fiscal year. The sample chart illustrates not only that compensation is the biggest expense, but just how big it is. In 2016-17 BIIS data, Salaries and Benefits sit squarely at 69 percent for all participating schools.
In this example dashboard chart, the hypothetical school spent 54 percent of total operating dollars on staff salaries; 15 percent on staff benefits; 14 percent on facilities management; and 17 percent on other administrative and instructional expenses (including technology and athletics).
Over time, schools can monitor changes in the composition of their expenses. While the relative sizes of these expenses typically don’t change dramatically, they can be affected by building projects, expansion of facilities or personnel, changes in program and more. The challenge for administrative and board leadership teams is to align their resource allocation decisions in these functional areas with brand positioning and critical mission elements. In some cases, this may mean an increase in spending for faculty and programing — for instance, if a school chooses to hire additional faculty to support increases in enrollment and net tuition revenue. More commonly, however, a school needs to reduce spending on faculty and programming to develop a more balanced and sustainable budget. This may require new ways of assessing and using human capital. These efforts tend to be most successful when schools intentionally engage faculty and staff in the value proposition dialogue and create a shared understanding of mission and brand alignment.
Staffing: Per-Student Ratios
The chart for per-student ratios (above) includes ratios for both student-to-faculty and student-to-all-FTEs as measures of the cost and efficiency of delivering a school’s program. Adding staff to improve a school’s value proposition is certainly legitimate; however a useful measure of school financial vitality is the extent to which a school can maintain or only moderately increase student-to-staff ratios.
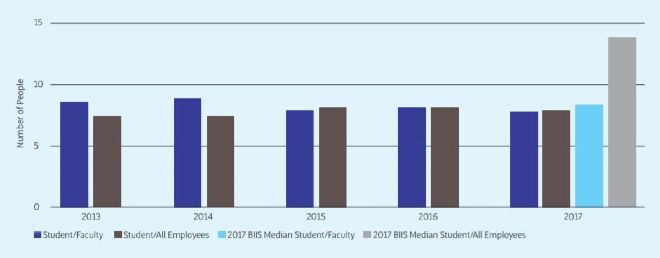
In this chart example, the hypothetical school had a student-to-faculty ratio of 7.8 to 1, against a BIIS median student-to-faculty ratio of 8.3. The school’s student-to-all-FTEs ratio of 7.9 compares to a BIIS median of 13.8 for all schools in the platform. This chart shows that the school has made significant faculty/instructional spending reductions since 2013, while maintaining minimum administrative overhead. Many schools require greater administrative or facilities support to carry out their programs.
Independent schools take pride in their low student-teacher ratios as key marketing differentiators that, many believe, are conducive to a better teaching and learning environment. But they come at a cost. The challenge is that small class sizes, experienced and superior educators, specialty classes and individualized learning opportunities often result in increasing personnel costs and overhead. By monitoring this data point, schools can keep a close eye on student enrollment and FTEs to prevent an upward trend causing an imbalance in the overall ratio. If FTEs creep up without a corresponding increase in students, tuition will be forced north as well.
