

Article by Mary Kay Markunas
The Financial Position Survey was one of NBOA’s original survey tools designed to facilitate leadership conversations about financial sustainability and factors vital to independent schools’ long-term health. The brief but powerful survey collected approximately 50 data points, which were then analyzed to determine key financial indicators. These data points and 20 key financial indicators had been incorporated into the Business Intelligence for Independent Schools (BIIS) data collection and reporting platform earlier, and this year they are available in the form of the financial position survey (FPS) range table.
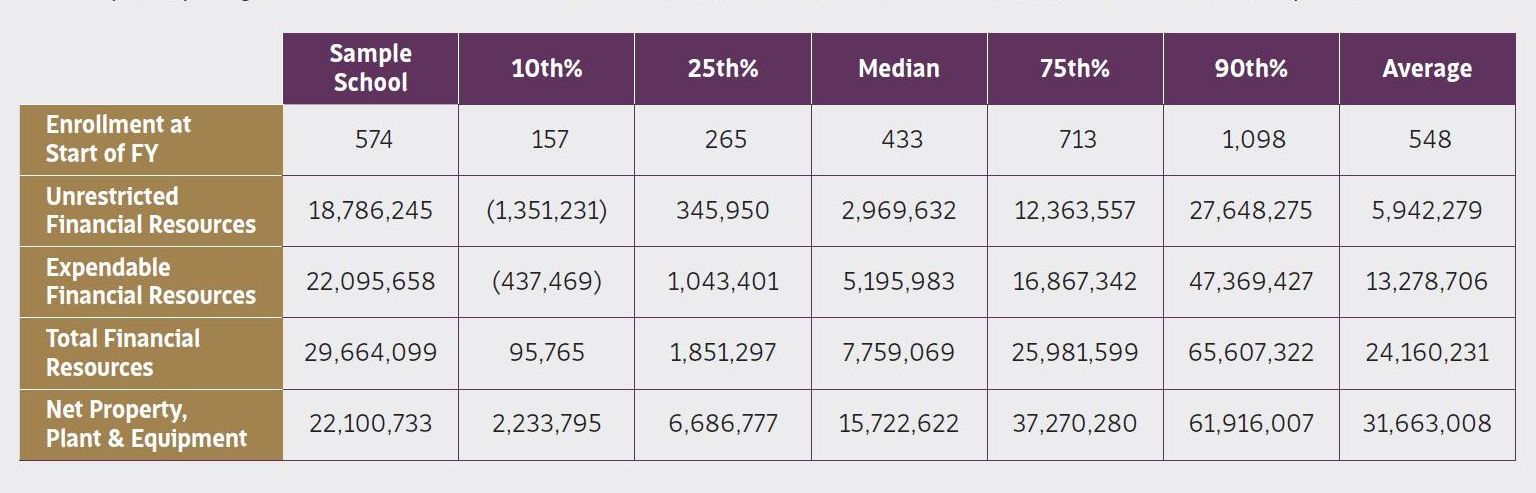
Sample School FPS Range Table
This table shows the first five indicators of a sample school, drawing from fiscal 2018 data and that year’s full BIIS data set (352 schools). Schools participating in BIIS will see all 20 indicators with fiscal 2019 data and can create different cohorts for comparison.
The range table allows BIIS participants to use different filters to see how their FPS ratios compare to other schools’ ratios. The filters are the same as those available for other BIIS benchmarking tools, such as school type, size and region. You can download the table to save the information for reference or use it in presentations.The FPS range table along with BIIS’s benchmarking tools, the CFI calculator and NBOA Financial Dashboard report provide a powerful view of your school’s financial picture. Together these tools provide compelling ways to present that information so that school leaders and the board may have robust conversations regarding your school’s financial health. Fiscal 2019 data is now available for reporting in BIIS for member schools that entered data. For more information, see nboa.org/biis, contact me (marykay.markunas@nboa.org) or Elizabeth Dabney, NBOA’s new director, research and data analysis (elizabeth.dabney@nboa.org).
Sample School FPS Range Table
This table shows the first five indicators of a sample school, drawing from fiscal 2018 data and that year’s full BIIS data set (352 schools). Schools participating in BIIS will see all 20 indicators with fiscal 2019 data and can create different cohorts for comparison.
Mary Kay Markunas is NBOA’s director, member resources and programs.
Download a PDF of this article.
