Article by Mary Kay Markunas
Reflecting a resurgent stock market overall, independent school endowments reversed course in fiscal 2017 and achieved significant growth at every level, according to the 2017 Commonfund Benchmarks Study of Independent School Endowments. The study looked at endowment returns across five size cohorts, from less than $10 million to more than $50 million. Overall one-year returns rose to an average of 11.8 percent, net of fees, compared to -0.8 percent in fiscal 2016 and 2.3 percent fiscal 2015. It was the best year since when endowments returned 14.2 percent.
Returns for college and university endowments averaged 12.2 percent for the year, according to Commonfund’s annual study for higher education.
Looking at the performance of different asset classes, non-U.S. equities had the highest returns in fiscal 2017, at 20.2 percent. They were the laggard class in fiscal 2016. By comparison, fixed income went from (3.6 percent) to laggard (2.4 percent) across the two years. U.S. equities were the second-highest returning asset class (17.6 percent), followed by alternative strategies (7.8 percent).
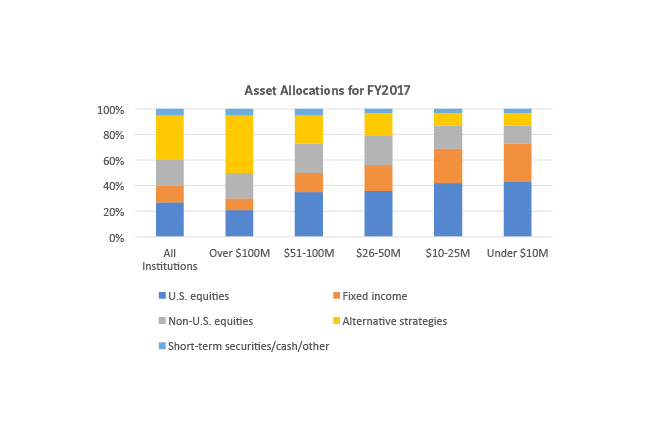
For the first time in 2017, Commonfund expanded the number of cohorts analyzed from three to five due to increased participation. The five categories:
- Over $100 million
- $51-100 million
- $26-50 million
- $10-25 million
- Under $10 million
There were some notable differences in allocation strategies among the cohorts. Institutions with assets over $100 million reported a 45 percent allocation to alternative strategies, for instance, compared to 22 percent for those with assets between $51 million and $100 million. U.S. equities were the primary investment class for four of the five cohorts.
Find expanded data and much more analysis of long- and short-term returns, active versus passive strategies, asset allocation, fund flows and fund management in the full report from Commonfund (free for NBOA members).


