

Early in the COVID-19 pandemic, NBOA periodically surveyed our member schools to gather and disseminate the most up-to-date information on independent schools’ operational and financial responses to the crisis. In fall 2020, we asked members to predict how their schools would fare financially in the 2021 fiscal year. FY21 is now behind us, and it’s time to see if these projections held true. I analyzed data from Business Intelligence for Independent Schools (BIIS) in three areas: surplus and deficit, cash and financial aid awards.
Surplus and Deficit
The prediction: Only 19% of schools anticipated a surplus in FY21, and 51% of schools anticipated a deficit.
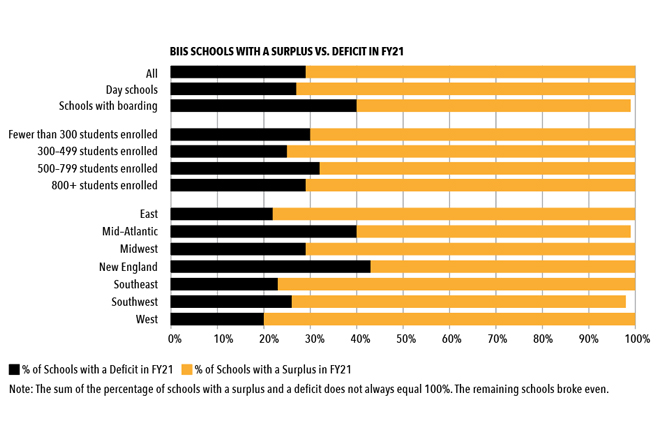
The results: 71% of schools experienced a surplus in FY21, and 29% saw a deficit, as measured by the difference in total operating income and total operating expenses. This is a much better outcome than predicted in October 2020, when unanticipated operational expenses resulting from the COVID-19 pandemic made budgetary management increasingly difficult at the time.
71% of schools experienced a surplus in FY21, and 29% saw a deficit, as measured by the difference in total operating income and total operating expenses.
Day schools, schools with 300-499 students enrolled, and schools in the East (New Jersey, New York), Southeast, Southwest and West regions fared particularly well, with at least 72% of schools ending the 2021 fiscal year with a surplus.
While schools may have been expending funds on pandemic-specific needs, other types of expenses — such as athletic or auxiliary costs — were lower than usual, resulting in a moderate 2.4% increase in median total operating expenses per student (from $27,366 in 2019-20 to $28,031 in 2020-21). Some schools had their incomes supported by Paycheck Protection Program (PPP) loan forgiveness and/or strong investment returns.
Cash
The prediction: 34% of schools anticipated an increase in their draw from cash reserves over FY20, not including draws from endowment or other investments.
The results: 17% of schools increased the amount of funds drawn from their accumulated surplus/reserves from FY20 to FY21, less than predicted. Many of the schools that increased their draw from reserves did not draw any of these funds in FY20.
One of the early lessons learned at the outset of the pandemic was that funds tied up in endowment or investments are of little use in an emergency when cash is needed. The average number of days of cash on hand increased from 113 days in FY20 to 116.5 days in FY21 (the median number of days was 103 in FY20 and 102 in FY21). The number of days of cash on hand is cash and cash equivalents divided by daily expenditure (total operating expenses divided by 260 days). However, schools with a boarding component, the largest schools and schools in the New England, Mid-Atlantic and Midwest regions had a lower than average number of days of cash on hand.
School Type | Average Days of Cash on Hand |
All | 116.5 |
Day schools | 119 |
Schools with boarding | 104 |
Fewer than 300 students enrolled | 118 |
300–499 students enrolled | 116 |
500–799 students enrolled | 119 |
800+ students enrolled | 112 |
East | 132 |
Mid-Atlantic | 91 |
Midwest | 87 |
New England | 114 |
Southeast | 129.5 |
Southwest | 124 |
West | 134 |
Financial Aid Awards
The prediction: 48% of schools projected an increase in financial aid awards up to 10% above FY20. 21% of schools projected an increase of 10-25%, and 5% of schools projected an increase of more than 25%. In total, 74% of schools projected an increase in financial aid awards.
The result: 75% of schools saw an increase in the total amount of need-based financial aid awarded between FY20 and FY21. 30% of schools had an increase up to 10%, 31% had an increase of 10-25% and 14% had an increase larger than 25%. 60% of schools also saw an increase in the number of students receiving need-based financial aid.
While the proportion of schools increasing the total amount of need-based financial aid awarded was close to what was predicted, the magnitude of the change was not. More schools experienced larger increases than expected, with about triple the percentage of schools increasing financial aid awarded by more than 25%.
It’s no surprise that independent schools worked to meet the financial needs of their families. Knowing that financial aid is an important part of many schools’ business models and missions, tuition discounts still impact revenues. It will be important to monitor financial aid in the coming years to determine if this increase was a temporary change or part of an ongoing trend.
You can find more analysis of BIIS financial and operational indicators covering the pandemic years 2019–2021 in NBOA’s Financial State of the Industry report.

